Here, we share our experiences in technology exploration, practical applications, and product solutions. We document every step of the journey, from research and development to real-world implementation.We believe that the true value of technology lies not only in innovation, but also in communication and knowledge sharing. Through the exchange of ideas, expertise, and experiences, we hope to learn together, grow continuously, and create greater value.
Simulating IoT Device Connectivity Monitoring Using Vue 3, Vite, and MQTT
First, install Mosquitto as the MQTT broker. Then, use MQTTX to simulate MQTT operations and quickly create a new Vue 3 project with Vite. After that, integrate mqtt.js to establish a connection with the MQTT broker and display the data transmitted from IoT devices in real time.
Neil Tsai
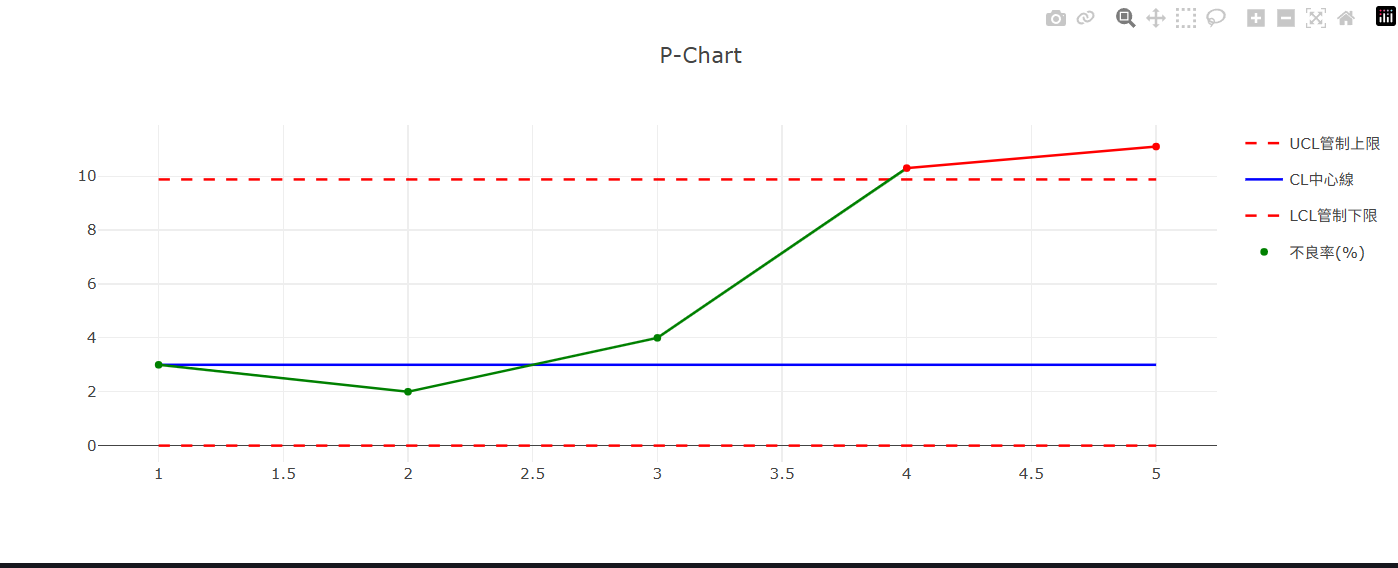
Implementing Statistical Charts with Plotly.js in Vue 3, Vite, and JavaScript- A P-Chart (Fraction Defective Control Chart) Example
First, use Vite to quickly create a new Vue 3 project with JavaScript as the default programming language. Then, install and integrate Plotly.js step by step to implement statistical process control charts. In this example, we will use a P-Chart (Fraction Defective Control Chart), commonly referred to as a P Chart, to demonstrate the implementation.